Zero Fundamentals: Build Routes
This guide shows you how to build a route to Grafana in Pomerium Zero. Watch the video to see the steps in action, or read the guide below.
This guide assumes you've completed the Pomerium Zero Quickstart.
Routing in Pomerium
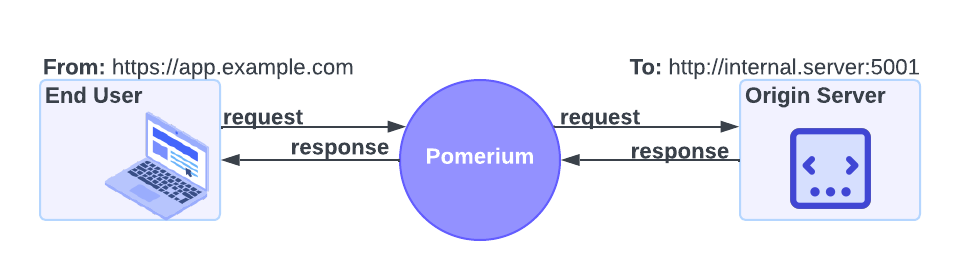
In Pomerium, Routing makes it possible for the Proxy service to manage requests and responses between a client and an upstream service.
To route requests and responses to the correct locations, the Proxy service requires two URLs:
- The From URL. This URL defines the external, publicly accessible URL of a proxied request. It tells the Proxy service to listen for requests from this location.
- The To URL. This URL defines the destination of the request, and can be an internal or external resource. It tells Pomerium where to proxy the request to.
How to build routes in Pomerium Zero
To learn how to build routes, you'll follow these steps:
- Configure a service in Docker Compose
- Build a route to the service
- Access your secured service behind Pomerium
Configure Grafana
The service you'll secure is Grafana, an open-source observability platform. In the same docker-compose.yaml file where you're running Pomerium Zero, add the Grafana configuration below:
grafana:
  image: grafana/grafana:latest
  ports:
    - 3000:3000
  networks:
    main: {}
  volumes:
    - ./grafana-storage:/var/lib/grafana
Build a route
In the Routes:
-
Select Routes from the sidebar, create a new route, and name it something obvious, like Grafana.
-
In the From field, select https:// from the protocol dropdown. In the next field, enter the external URL. It should follow this format:
grafana.<CLUSTER_STARTER_DOMAIN>.pomerium.app -
In the To field, enter the destination URL:
http://grafana:3000 -
In the Policies field, select Any Authenticated User.
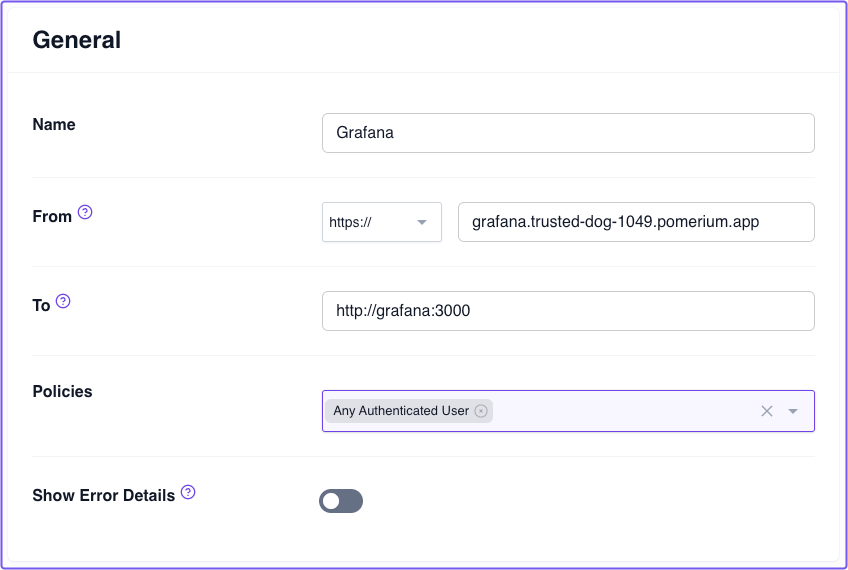
Save your route and apply the changeset.
Access the route
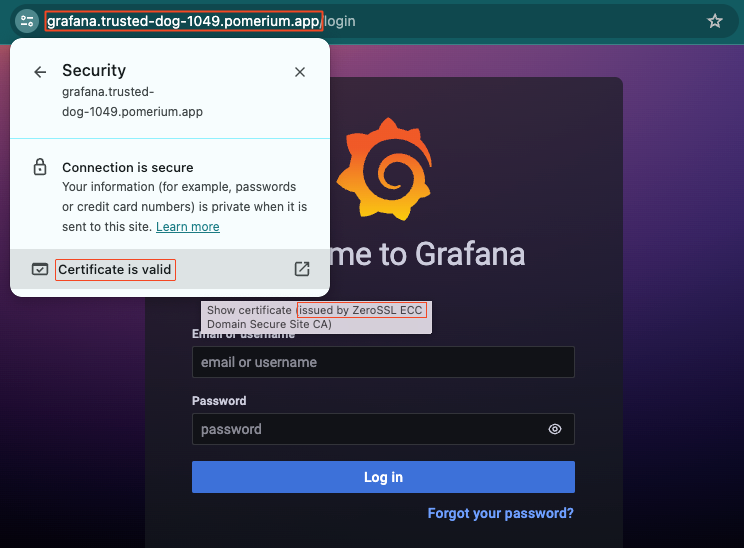
Now, in your browser, navigate to the external From URL you just saved. You'll notice you're accessing Grafana over the external URL. This means you've successfully configured Pomerium to proxy requests to Grafana.
If you look at the route's TLS certificate, you'll notice the certificate was issued by ZeroSSL on behalf of your cluster domain. This means the connection between the client and Grafana is secured over TLS!
Up Next: Build Policies
Great job! You successfully built a route in Pomerium Zero. Next, you'll learn how to build authorization policies.
Go to Build Policies.
Configuration file state
At this point, your Docker Compose file should look like this:
services:
  pomerium:
    image: cr.pomerium.com/pomerium/pomerium:v0.27.2
    ports:
      - 443:443
    restart: always
    environment:
      POMERIUM_ZERO_TOKEN: <YOUR_CLUSTER_TOKEN>
      XDG_CACHE_HOME: /var/cache
    volumes:
      - pomerium-cache:/var/cache
    networks:
      main:
        aliases:
          - verify.<YOUR_CLUSTER_SUBDOMAIN>.pomerium.app
  verify:
    image: cr.pomerium.com/pomerium/verify:latest
    networks:
      main:
        aliases:
          - verify
  grafana:
    image: grafana/grafana:latest
    ports:
      - 3000:3000
    networks:
      main: {}
    volumes:
      - ./grafana-storage:/var/lib/grafana

networks:
  main: {}

volumes:
  pomerium-cache: